Debugging JavaScript with the Browser Debugger
When I caught myself repeatedly re-running code, adding a console.log statement each time, I knew it was time to finally acquaint myself with the debugger.
This post is a quick introduction to Firefox’s JavaScript debugger. Chrome’s debugger is practically identical. This should also serve as a decent introduction to debuggers in general.

Firefox Debugger layout
A breakpoint is an event at which program flow is paused and you get the opportunity to explore:
- various scopes
- the call stack
- values of variables
- …
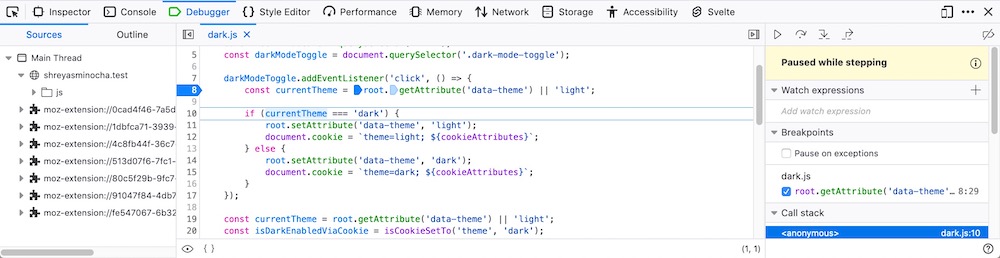
Let’s set a breakpoint at line 8. Hover over the line number and click.
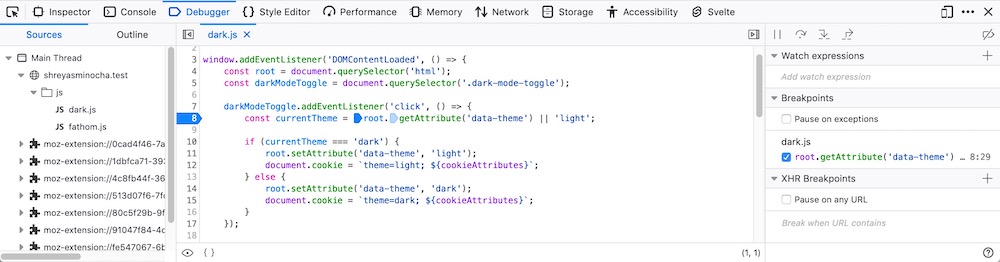
Breakpoint set at line 8
Just before this line is executed, program flow will be paused. Let’s click the theme toggle button to see this in action:
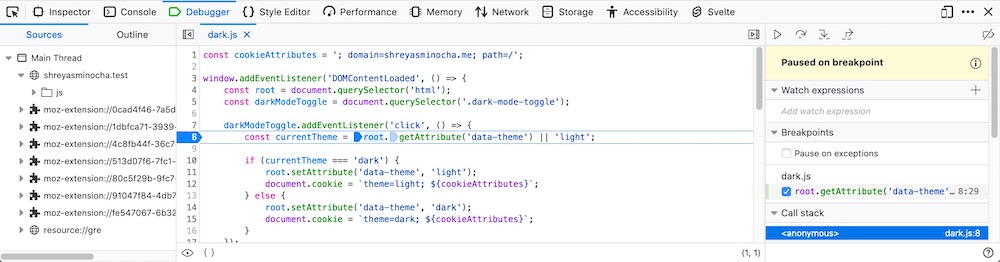
Flow paused at line 8
We can now inspect all sorts of stuff, either using the panel on the right, or by hovering over variables in the code.
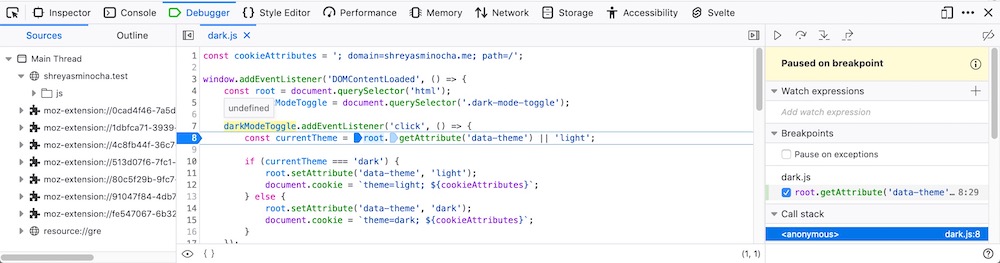
Hover over variables and functions to inspect them
The right sidebar also bears useful information including, for example, values of variables in various scopes.
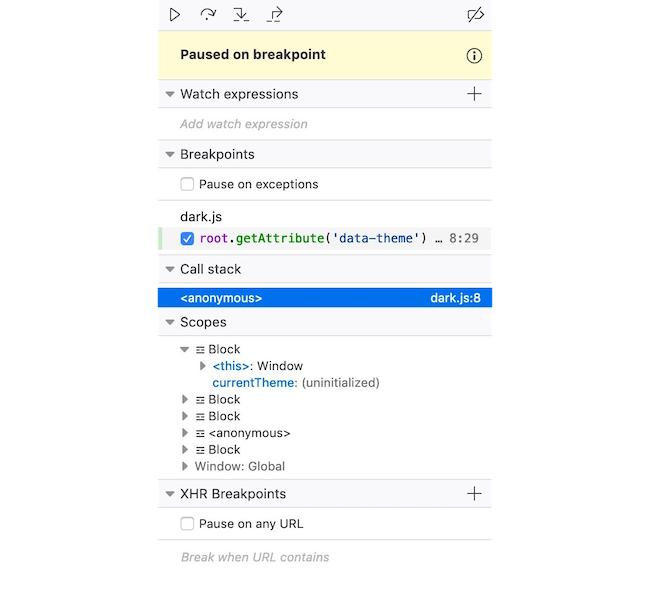
The right sidebar
Flow controls allow tracing the program flow step-by-step. They’re very useful when you’re trying to pinpoint the location of unexpected behaviour and values.

Flow controls!
Flow controls (left to right):
-
Play/Pause
Resume or pause program flow.
-
Step over
Continue to the next instruction in the current method.
-
Step in
If there are any method calls in the current line, descend into them walk through their lines. Else, continue to the next instruction in the current method.
-
Step out
Analogous to
Step in. Go back to the lines that called the current method — pause after control is returned to those lines. -
Deactivate/Re-activate breakpoints
Toggle whether all breakpoints are enabled.
Let’s try stepping over a couple of times.
Paused at the if condition
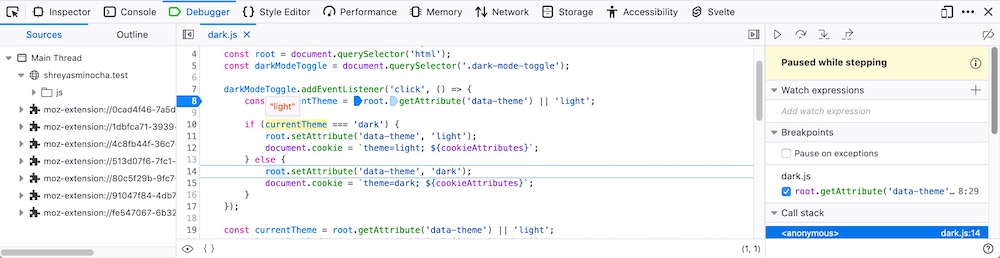
Paused inside the else clause
The right sidebar has a checkbox to enable pausing each time an exception is encountered. You can use the right sidebar to set breakpoints for XHR requests too.
You can also add watch expressions in the right sidebar. Each time program flow is paused, these expressions will be evaluated and will be visible for inspection.
That’s all! While not a complete guide, this should be enough to get you started. I used to find the debugger intimidating, but it was easy to get the hang of it once I got my hands dirty.
Shreyas Minocha